

Adding Charts to your Meadow HMI
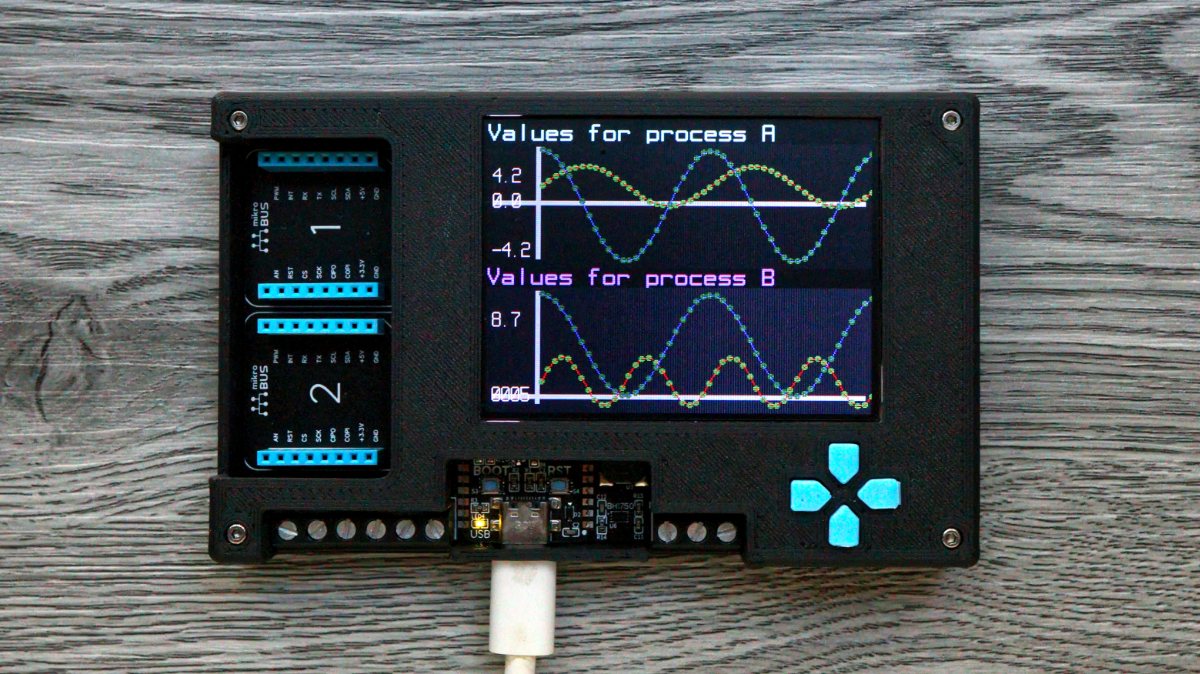
Our MicroLayout library provides a lightweight framework for creating HMIs with labels, buttons and images but sometimes that’s just not quite enough to give your users the information you want. IoT devices very often collect time-series telemetry, and displaying that data is usually meaningful and helpful so I wanted to add some capability for that.
MicroLayout now (as of Beta 1.3.2) supports a LineChart which, as the name suggests, is a line chart control. In keeping with the ideas of MicroLayout, it’s not heavy on features but hopefully provides enough capability for many applications. It supports multiple series per chart, lines, markers or both – and color and size support for lines and points.
Here’s a quick example of how you can add a label and chart to your display:
var display = new WinFormsDisplay();
_screen = new DisplayScreen(display);
_screen.BackgroundColor = Color.Black;

var labelFont = new Font12x20();
var chartLabel = new Label(0, 0, _screen.Width, 16)
{
    Text = "Values for process A",
    TextColor = Color.Aquamarine,
    Font = labelFont,
};

var chart = new LineChart(0, 16, _screen.Width, (_screen.Height) - 16)
{
    BackgroundColor = Color.FromHex("111111"),
    ShowYAxisLabels = true
};

chart.Series.Add(GetSeriesData());

_screen.Controls.Add(chartLabel, chart);
Let us know if you find any bugs or missing features, or even if you simply end up using it, over on our Slack channel. As usual the control is open-source, so feel free to extend and PR anything you think might be helpful to the rest of the community. Keep coding!