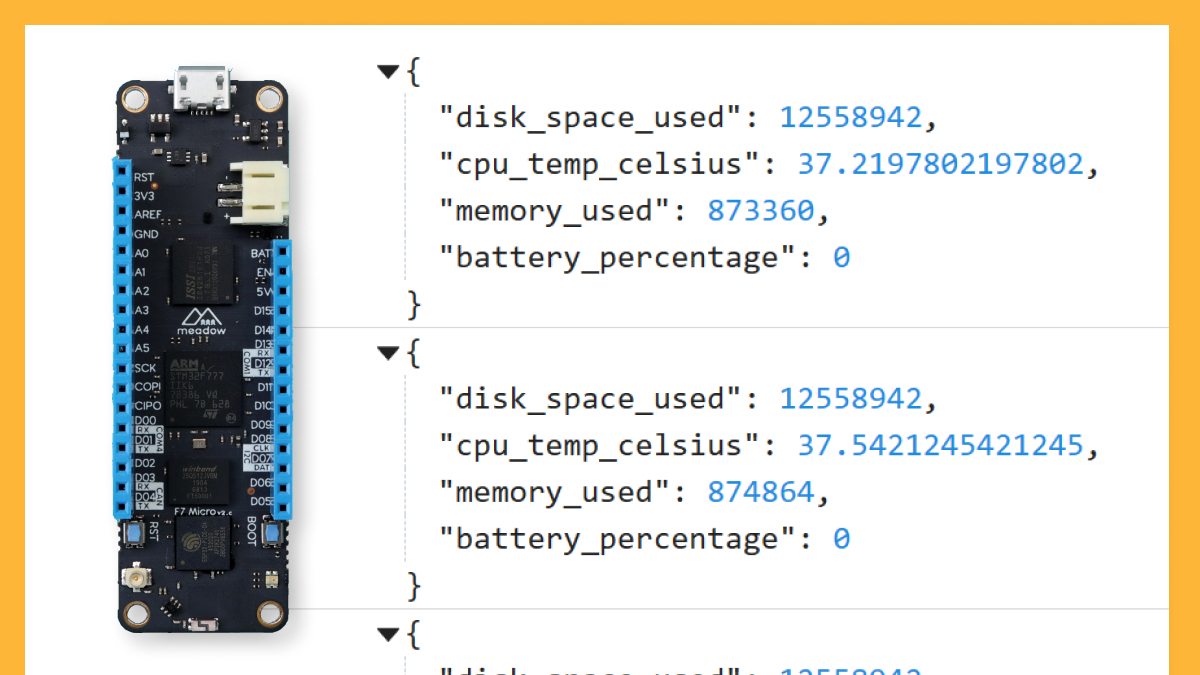
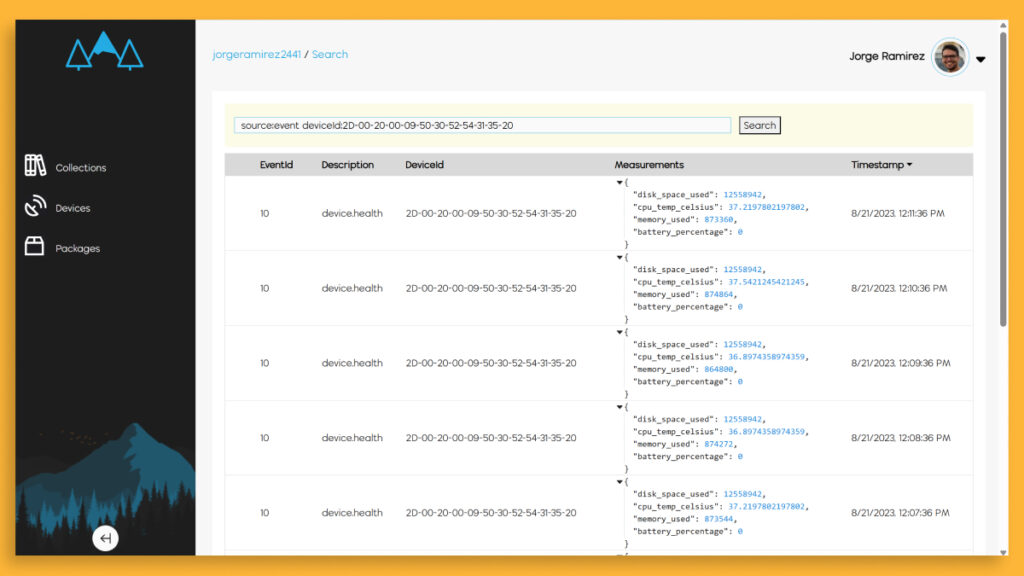
Monitor your device and app health painlessly with Meadow.Cloud.

Simply running your application is usually the primary focus of an IoT solution, but how do you know if it’s running well? How do you track if the app is crashing and the device is rebooting? How do you know what devices in the field are still alive?
Device health telemetry is a breeze with Meadow.Cloud and will give you not just that information, but a host of metrics about your app and device health.

With the Meadow 1.4 release, we’ve added some capabilities to allow you to query more device telemetry. You can use this information directly in your application to make run-time decisions, and seamless send it to Meadow.Cloud for remove health monitoring when devices are in the field.
All device telemetry lives in the PlatformOS class. Here’s a quick example of how to query (and display) telemetry data on a Meadow F7-based platform:
var memoryInfo = (Device.PlatformOS as F7PlatformOS)?.GetMemoryAllocationInfo();
var gcAlloc = GC.GetTotalMemory(false);

if (memoryInfo.HasValue)
{
    Resolver.Log.Info($" Memory");
    Resolver.Log.Info($"   Total memory: {memoryInfo.Value.Arena:n0}");
    Resolver.Log.Info($"   Total allocated: {memoryInfo.Value.TotalAllocated:n0}");
    Resolver.Log.Info($"   Total free: {memoryInfo.Value.TotalFree:n0}");
    Resolver.Log.Info($"   GC Allocated: {gcAlloc:n0}");
}


var load = Device.PlatformOS?.GetProcessorUtilization().Average();
Resolver.Log.Info($" Processor");
Resolver.Log.Info($"   Usage: {load}%");

var storage = Device.PlatformOS?.GetStorageInformation();
Resolver.Log.Info($" Storage");
Resolver.Log.Info($"   {storage[0].SpaceAvailable.MegaBytes:0.00}/{storage[0].Size.MegaBytes:0.0}MB");
Resolver.Log.Info($"\r\n");
Are there any other telemetry items that you’d like to be able to monitor in your platform? Add a feature request or let us know over in our public Slack channel!


