

Enterprise-Grade Monitoring Now Standard: Grafana Dashboards and InfluxDB Come to Meadow.Cloud
We’re excited to announce that Grafana dashboards and indefinite InfluxDB time-series data storage are now included in the Meadow.Cloud Enterprise tier – at no additional cost.
Built for Industrial and Critical Infrastructure
For teams managing industrial operations and critical infrastructure, having the right data at the right time isn’t just convenient, it’s essential. That’s why we’re bringing best-in-class monitoring, reporting, and alerting tools directly into your Meadow.Cloud environment.
What’s New
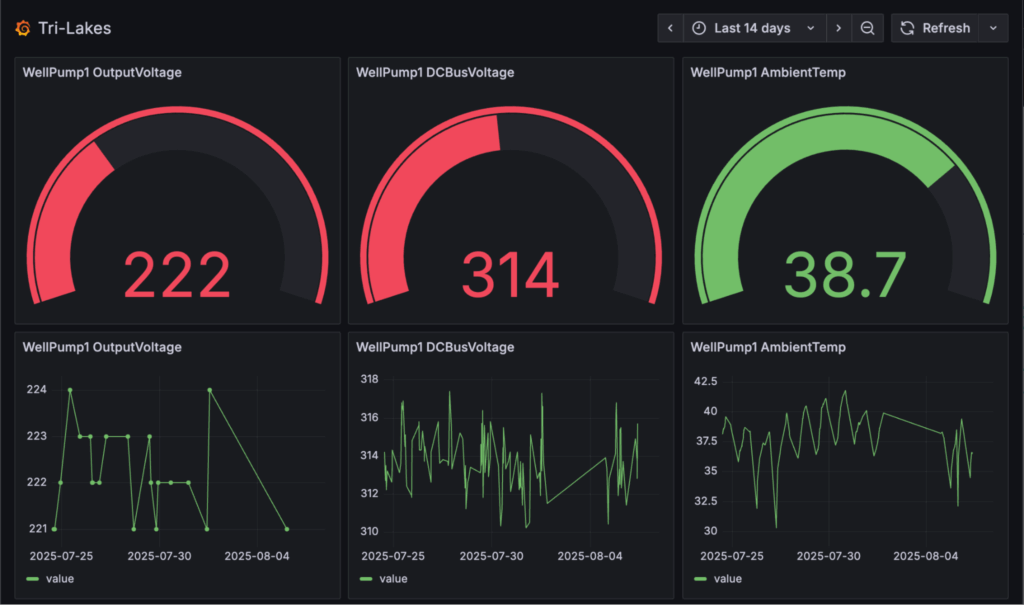
- Grafana Dashboards – Create custom visualizations tailored to your operations. Whether you’re monitoring production lines, energy systems, or distributed infrastructure, build dashboards that show exactly what your team needs to see.
- InfluxDB Time-Series Storage – Keep your IoT data indefinitely with purpose-built time-series database storage. No more worrying about data retention limits or losing critical historical information needed for trend analysis and compliance.
- Alerting & Reporting – Set up intelligent alerts to catch issues before they become problems, and generate reports for compliance and governance.
Why This Matters
Industrial environments generate massive amounts of sensor and operational data. Having professional-grade tools to visualize, analyze, and act on that data shouldn’t require separate subscriptions, complex integrations, or additional vendor relationships. With these capabilities now included in Enterprise, you get a complete monitoring solution that’s ready to use from day one.
Getting Started
Current Meadow.Cloud Enterprise customers can access Grafana and InfluxDB immediately through their dashboard. If you’re interested in upgrading to Enterprise to take advantage of these capabilities, reach out to our team to learn more.
Here’s to better visibility, faster insights, and more reliable operations.